
Data Architecture & Zoho Analytics
You should never have to guess how your business is performing.
If management needs multiple spreadsheets, reports and meetings to understand what's happening, the problem may be deeper than reporting.
Reliable decisions depend on reliable information. But when operational data is fragmented across systems, departments and processes, building another dashboard doesn't necessarily solve the problem. Infolytics engineers the data structures, system connections, operational controls and reporting environments needed to provide a clearer view of the business.
No product pitch. We start with the business problem.
Trusted by organisations across Southern Africa




Lots of information. Not enough clarity.
Your organisation may be collecting more information than ever. Yet management still struggles to answer important questions.
- What is happening across the sales pipeline?
- Which customers or transactions require attention?
- Where are processes getting delayed?
- How is operational performance changing?
- Which activities are creating bottlenecks?
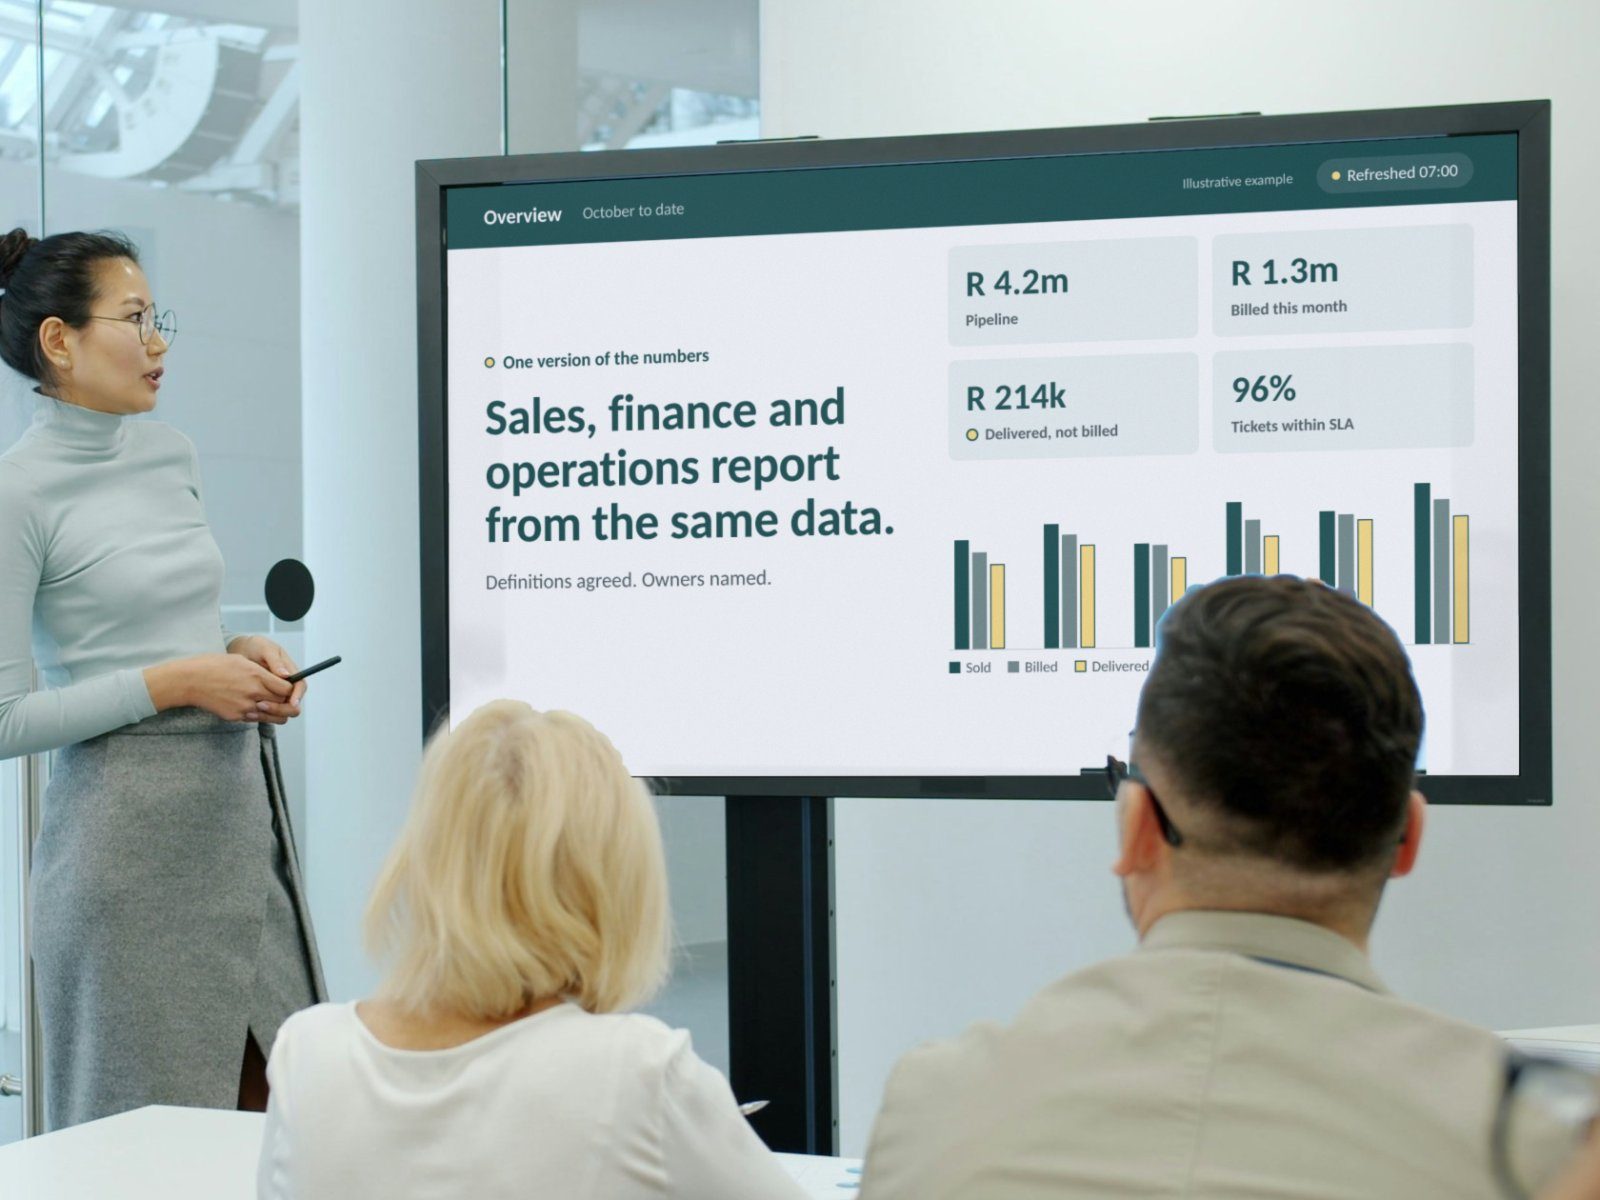
- What is the relationship between sales, billing and delivery?
- Can we trust the information in management reports?
- Why do different departments report different figures?
When the answers require manual reconciliation or depend on individual interpretations, the business does not have dependable operational visibility.
A dashboard cannot compensate for inconsistent data and disconnected processes.
Better visibility starts below the dashboard.
We don't begin by choosing charts.
We begin by understanding the questions management needs answered and the operational processes that produce the information.
Then we examine the data and system architecture required to answer those questions reliably.
What do you currently struggle to see clearly?
Select all that apply.
0 visibility requirements selected
What you can't see clearly today
Manually consolidated reporting compared with an integrated operational data environment
| Aspect | Manually consolidated | Integrated operational data |
|---|---|---|
| Where figures come from | Exports from several systems, combined in spreadsheets | Connected operational data from defined sources |
| Time to produce | Days of preparation before each management meeting | Available when the question is asked |
| Definitions | Each department calculates the same measure its own way | Agreed definitions, each with a named owner |
| Exceptions | Found after the fact | Flagged while there is still time to act |
| Trust | Figures are debated in the meeting | Figures reconcile to their source |
What we engineer
- Management reporting architecture
- Define reporting requirements, measures, dimensions and supporting data structures.
- Connected operational data
- Bring relevant information together across sales, finance, service and operations.
- Data quality and consistency
- Identify inconsistencies and establish the controls needed to improve reliability.
- Operational dashboards
- Present information in a way that supports relevant decisions.
- Exception monitoring
- Highlight overdue work, delays, anomalies and operational situations requiring attention.
- Cross-department reporting
- Establish a consistent view across functions that previously reported independently.
- Reporting governance
- Define metric ownership, definitions, permissions and responsibilities.
From fragmented information to informed decisions.
Define the decisions
Understand what management needs to know and why.
Identify the information
Determine which systems, records, processes and measures are required.
Engineer the data foundation
Address relevant data models, integration, consistency and control requirements.
Build the reporting environment
Design dashboards, reporting structures and appropriate operational alerts.
Validate the results
Reconcile reported measures against agreed definitions and source information.
Embed management visibility
Help teams use the information in their normal operating and decision-making processes.
The goal is not more reports. It's greater operational clarity.
Management should be able to understand what is happening, identify where attention is needed and make decisions using information the organisation can trust.

What happens when the system works.
Our customers bring us different problems. The common thread is complexity: processes, systems, data and teams that need to work together.
Integrated e-commerce, sales, finance, inventory and logistics into one connected operating flow.
They are knowledgeable, honest and transparent.
What we value most is having access to senior management and domain experts when we need them.
Who this is for
Infolytics is best suited to organisations where systems have become an important part of how the business operates. You may have:
- Significant volumes of customers, transactions or operational data.
- Management decisions that depend on figures from several departments.
- Reports that need manual reconciliation before anyone trusts them.
- Departments that report different figures for the same thing.
If you simply need another dashboard, we may not be the right partner.
If the problem crosses processes, departments, data and systems, that's where our work becomes valuable.
Can your systems answer the questions your business depends on?
Tell us which decisions are difficult to make and which information you struggle to obtain. We'll help determine what needs to change beneath the reporting layer.
What happens when you speak to us?
This isn't a generic software demo. In the first conversation, we want to understand:
- What are you trying to achieve?
- Where is the business struggling today?
- Which processes, teams and systems are involved?
- What have you already tried?
- What is the operational consequence if the problem isn't solved?
From there, we'll recommend whether the next step is an audit, formal Discovery, solution architecture or implementation, or whether there's a simpler answer.
No sales pitch. Confidential conversation. Practical next steps.